
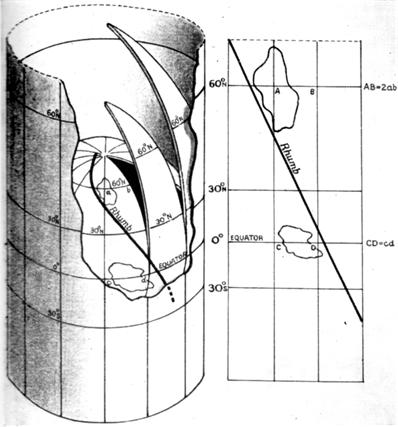
 Years ago during one of my many excursions into the history of mathematics I wondered how Mercator used logarithms in his map projection (introduced in a 1569 map) when logarithms were not discovered by John Napier (1550-1617) and published in his book Mirifici Logarithmorum Canonis Descriptio until 1614, three years before his death in 1617. The mystery was solved when I read a 1958 book by D. W. Waters which said Edward Wright (1561-1615) in his 1599 book Certaine Errors in Navigation produced his “most important correction, his chart projection, now known as Mercator’s.” Wright did not use logarithms explicitly but rather implicitly through the summing of discrete secants of the latitude as scale factors. But what really caught my attention in the Waters book was this arresting footnote: “Wright explained his projection in terms of a bladder blown up inside a cylinder, a very good analogy.” This article recounts my exploration of this idea. See Mercator Projection Balloon.
(Update 4/2/2022) Balloon Idea as Rubberband
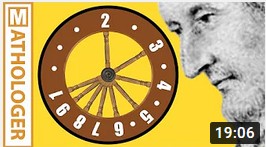 Imagine my surprise when I realized Burkard Polster’s latest Mathologer post “The magic log wheel: How was this missed for 400 years?” involving a circular sliderule presented the logarithm effect as stretching a rubberband around a circle. This is essentially the balloon effect only sort of in reverse.
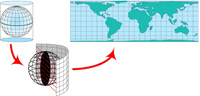 One thing I have always been curious about, but never got around to investigating, is how hard is it to see that the Lambert Equal-Area Projection of a sphere onto a cylinder in fact preserves areas? This 2012 essay attempts to provide an answer. The essay was recently updated to provide a link to the fabulous Youtube site by Grant Sanderson at
 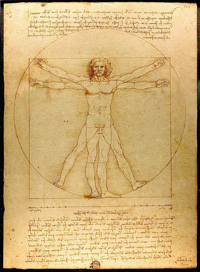 This is a mildly pointless 2015 article about Leonardo Da Vinci’s famous drawing of the Vitruvian Man spread-eagled and inscribed in a circle and a square. I started wondering about the positions and whether they over-determined the circle and square. What hidden constraints were being assumed? One assumption turned out to be famous, namely, that the height of a man equaled the distance between his finger tips when he holds his arms straight out to either side of his body. I had been told this in childhood, and I never knew where it came from. Also, I don’t think it is true in every case (what about women?), though it does appear to be close (and is true in my case). See the
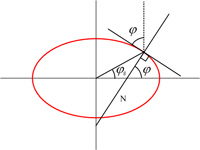
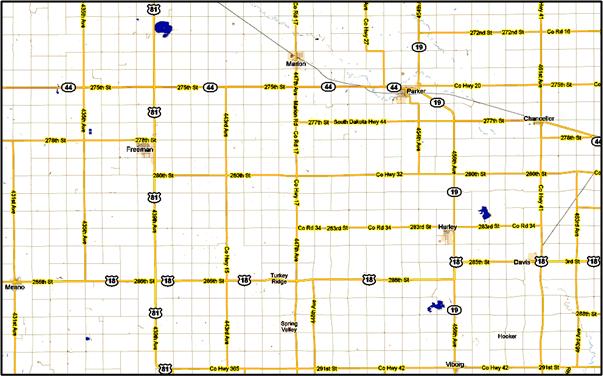 This light-weight problem arose from a newspaper article that had me looking at a Google map of the area near Sioux Falls, South Dakota. What I saw was an excellent example of the Taxicab Geometry, allegedly first considered by Hermann Minkowski, mathematical friend of Albert Einstein. The map configuration was perpetrated by the great Public Land Survey System (PLSS) that originated with Thomas Jefferson and spread from Ohio (more or less) west to the California coast. This scheme overlaid the country basically with a 1 mile x 1 mile square grid of roads, and South Dakota is a prime example.