
 Given the mathematical nature of this website I feel reluctantly impelled to address the coronavirus pandemic. The mathematics behind the spread of infection is basically the same exponential growth that I discussed in the “Math and Religion” post and has recently been explained by the ever-lucid Grant Sanderson at his 3Blue1Brown website.
What I wish to draw attention to is the series of posts on the coronavirus by Kevin Drum on his website at Mother Jones. I have collected his recent posts comparing the spread of the virus in various countries and added some mathematical commentary of my own, which is the content of this post.
But the bottom line seems to be that in virtually all the countries, including the US, the virus infection is spreading at the Italian rate of doubling every 4 days! The readers of this website are sufficiently numerate to realize the frightening import of that number. If that weren’t enough, Kevin provides additional posts on the results of the modeling at the Imperial College that are truly nerve-wracking for someone such as myself in the most vulnerable cohort. The only blessing so far seems to be that, for once, the children are spared.
At this time, I don’t have the stomach to keep updating the post as new numbers come in. That may change. I could address the catastrophe of having ignorance and incompetence at the helm of the national ship of state, but it is too depressing.
See the Coronavirus Mathematics
(Updates 3/17/2020, 3/21/2020, 4/17/2020, 9/20/2020, 10/1/2020)
(Update 3/17/2020) That didn’t take long. But Kevin Drum had an update to his curves that I thought was relevant, so I have included it in a revised version of his posts. He is also saying his plots show a 5-day doubling rate instead of the 4-day that I had determined—infinitesimal consolation.
(Update 3/21/2020) Kevin Drum had a significant update regarding the mathematical model for the growth of the infection. It is not ultimately exponential or even logistic. Contrary to religious conversion, which is essentially permanent, infections go away when the subject either is cured (likely) or dies (less likely). So the ultimate shape of the curve is closer to a Gaussian distribution.
Coronavirus Growth in Western Countries: March 18 Update
Kevin Drum, March 19, 2020
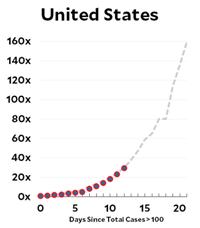
Here’s the coronavirus growth rate through Wednesday. The US is now slightly above the Italian trendline, possibly because we’ve picked up the pace of testing.
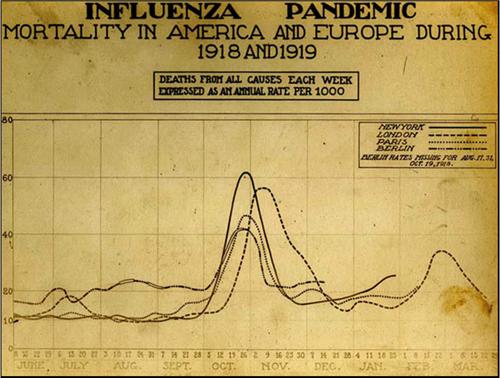
A couple of notes. First, a friend emails to warn me against calling the spread of coronavirus “exponential.” Technically, that’s true. At the beginning of a viral outbreak the growth rate is pretty much exponential, but it slows down later. This article suggests that it then follows a power law, and eventually it flattens out and then declines. When all’s said and done, the outbreak will follow a Gaussian path that looks like a familiar bell curve. For example, here is the growth curve of the Spanish flu in 1918, skyrocketing from nothing to massive death tolls over the course of only four weeks:
(Update 4/17/2020) After my previous postings, I would hope you are continuing to monitor Kevin Drum’s excellent updates and discussions. I would like to mention a different mathematical take on the situation, namely, simulations. Grant Sanderson at his excellent 3Blue1Brown Youtube blog (3/27/2020) has a marvelous epidemic simulation using a simple SIR model that illustrates the effects of
- Basic Setup (growth rate sensitive to # daily interactions, probability of infection, duration of illness)
- Identify and isolate
- Social distancing
- Travel restrictions
- R (effective reproductive number: #expected new infections by infected person during illness)
- Central hubs (periodically visit grocery store, etc.)

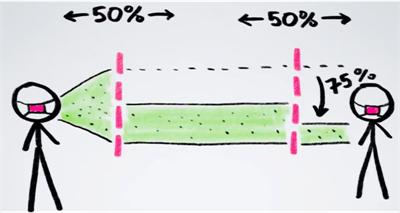
(Update 9/20/2020) Unusual Effectiveness of Masks. Henry Reich at Minute Physics has a great video (at Youtube with more information and links) about how much more effective masks are when many people wear them. For example, if two people are wearing masks that are each 50% effective, then together they become 75% effective in reducing the spread of virus particles.
And in a large crowd if 50% of the people are wearing masks that are 50% effective, then the overall effectiveness is 44%. So there is effective protection even when half a population is not wearing masks.
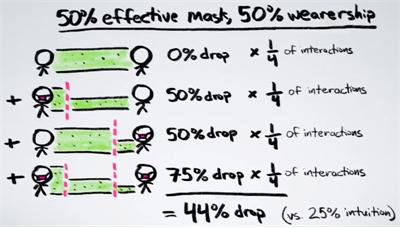
In fact, if 60% of the population would wear masks that are 60% effective, the infection rate R would drop below 1 and so the virus would stop spreading and be contained.
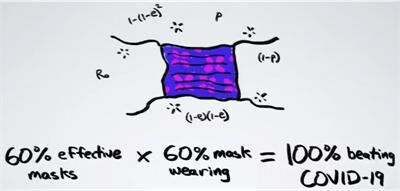
Henry Reich points to another website by Aatish Bhatia that goes into more detail with animated graphics.
(Update 10/1/2020) Key to the Pandemic
This article in the Atlantic on the pandemic is extremely significant and bears close reading. I have included some excerpts of main points, but the whole article is fascinating and helpful for understanding the pandemic.
(https://www.theatlantic.com/health/archive/2020/09/k-overlooked-variable-driving-pandemic/616548/, retrieved 10/1/2020)
This Overlooked Variable Is the Key to the Pandemic
It’s not R.
Zeynep Tufekci, September 30, 2020
… The definition of k, [the measure of its dispersion,] is a mouthful, but it’s simply a way of asking whether a virus spreads in a steady manner or in big bursts, whereby one person infects many, all at once. After nine months of collecting epidemiological data, we know that this is an overdispersed pathogen, meaning that it tends to spread in clusters, but this knowledge has not yet fully entered our way of thinking about the pandemic—or our preventive practices.
The now-famed R0 (pronounced as “r-naught”) is an average measure of a pathogen’s contagiousness, or the mean number of susceptible people expected to become infected after being exposed to a person with the disease. … Unfortunately, averages aren’t always useful for understanding the distribution of a phenomenon, especially if it has widely varying behavior. … [Superspreading is] a pattern that’s been observed many times since the pandemic begin, and that is similarly not captured by R. That’s where the dispersion comes in.
There are COVID-19 incidents in which a single person likely infected 80 percent or more of the people in the room in just a few hours. But, at other times, COVID-19 can be surprisingly much less contagious. Overdispersion and super-spreading of this virus are found in research across the globe. … Multiple studies from the beginning have suggested that as few as 10 to 20 percent of infected people may be responsible for as much as 80 to 90 percent of transmission, and that many people barely transmit it. …
We can think of disease patterns as leaning deterministic or stochastic: In the former, an outbreak’s distribution is more linear and predictable; in the latter, randomness plays a much larger role and predictions are hard, if not impossible, to make. … Diseases like the flu are pretty nearly deterministic and R0 (while flawed) paints about the right picture (nearly impossible to stop until there’s a vaccine). That’s not necessarily the case with super-spreading diseases. …
In study after study, we see that super-spreading clusters of COVID-19 almost overwhelmingly occur in poorly ventilated, indoor environments where many people congregate over time—weddings, churches, choirs, gyms, funerals, restaurants, and such—especially when there is loud talking or singing without masks. For super-spreading events to occur, multiple things have to be happening at the same time, and the risk is not equal in every setting and activity, Muge Cevik, a clinical lecturer in infectious diseases and medical virology at the University of St. Andrews and a co-author of a recent extensive review of transmission conditions for COVID-19, told me.
Cevik identifies “prolonged contact, poor ventilation, [a] highly infectious person, [and] crowding” as the key elements for a super-spreader event. Super-spreading can also occur indoors beyond the six-feet guideline, because SARS-CoV-2, the pathogen causing COVID-19, can travel through the air and accumulate, especially if ventilation is poor. Given that some people infect others before they show symptoms, or when they have very mild or even no symptoms, it’s not always possible to know if we are highly infectious ourselves. We don’t even know if there are more factors yet to be discovered that influence super-spreading. But we don’t need to know all the sufficient factors that go into a super-spreading event to avoid what seems to be a necessary condition most of the time: many people, especially in a poorly ventilated indoor setting, and especially not wearing masks. As Natalie Dean, a biostatistician at the University of Florida, told me, given the huge numbers associated with these clusters, targeting them would be very effective in getting our transmission numbers down.
Overdispersion should also inform our contact-tracing efforts. In fact, we may need to turn them upside down. Right now, many states and nations engage in what is called forward or prospective contact tracing. Once an infected person is identified, we try to find out with whom they interacted afterward so that we can warn, test, isolate, and quarantine these potential exposures. But that’s not the only way to trace contacts. And, because of overdispersion, it’s not necessarily where the most bang for the buck lies. Instead, in many cases, we should try to work backwards to see who first infected the subject.
Because of overdispersion, most people will have been infected by someone who also infected other people, because only a small percentage of people infect many at a time, whereas most infect zero or maybe one person. …
Another significant consequence of overdispersion is that it highlights the importance of certain kinds of rapid, cheap tests. Consider the current dominant model of test and trace. In many places, health authorities try to trace and find forward contacts of an infected person: everyone they were in touch with since getting infected. They then try to test all of them with expensive, slow, but highly accurate PCR (polymerase chain reaction) tests. But that’s not necessarily the best way when clusters are so important in spreading the disease. …
Meanwhile, researchers have shown that rapid tests that are very accurate for identifying people who do not have the disease, but not as good at identifying infected individuals, can help us contain this pandemic. … they are particularly valuable for cluster identification during an overdispersed one. …
In an overdispersed regime, identifying transmission events (someone infected someone else) is more important than identifying infected individuals. Consider an infected person and their 20 forward contacts—people they met since they got infected. Let’s say we test 10 of them with a cheap, rapid test and get our results back in an hour or two. … If everyone is negative, we can act as if nobody is infected, because the test is pretty good at finding negatives. However, the moment we find a few transmissions, we know we may have a super-spreader event, and we can tell all 20 people to assume they are positive and to self-isolate—if there are one or two transmissions, there are likely more, exactly because of the clustering behavior. … [O]verdispersion also enhances the utility of other aggregate methods, such as wastewater testing, especially in congregate settings like dorms or nursing homes, allowing us to detect clusters without testing everyone. …
Unfortunately, until recently, many such cheap tests had been held up by regulatory agencies in the United States, partly because they were concerned with their relative lack of accuracy in identifying positive cases compared with PCR tests—a worry that missed their population-level usefulness for this particular overdispersed pathogen.