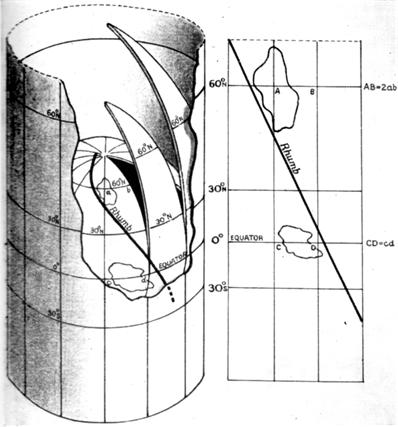
 Years ago during one of my many excursions into the history of mathematics I wondered how Mercator used logarithms in his map projection (introduced in a 1569 map) when logarithms were not discovered by John Napier (1550-1617) and published in his book Mirifici Logarithmorum Canonis Descriptio until 1614, three years before his death in 1617. The mystery was solved when I read a 1958 book by D. W. Waters which said Edward Wright (1561-1615) in his 1599 book Certaine Errors in Navigation produced his “most important correction, his chart projection, now known as Mercator’s.” Wright did not use logarithms explicitly but rather implicitly through the summing of discrete secants of the latitude as scale factors. But what really caught my attention in the Waters book was this arresting footnote: “Wright explained his projection in terms of a bladder blown up inside a cylinder, a very good analogy.” This article recounts my exploration of this idea. See Mercator Projection Balloon.
(Update 4/2/2022) Balloon Idea as Rubberband
 Imagine my surprise when I realized Burkard Polster’s latest Mathologer post “The magic log wheel: How was this missed for 400 years?” involving a circular sliderule presented the logarithm effect as stretching a rubberband around a circle. This is essentially the balloon effect only sort of in reverse.
